
If organic search sent more visitors to your site this year than last, did your SEO work? A yes that arrives in one second is usually wrong. Traffic counts arrivals. It does not count customers you can bill.
For most service businesses, organic search is one of the largest sources of website traffic, so it carries too much weight to report on loosely. A single rising line of sessions hides which service, and which city, produced the inquiry.
The useful cut is narrower: which page, for which service, in which city, produced an inquiry you could bill? Google Analytics SEO reports answer that only when you treat them as a documented boundary between two measurement systems, Analytics and Search Console, rather than a dashboard you trust on sight. Sessions and key events sit on one side of that boundary. Impressions, queries, and average position sit on the other. Report organic performance by service and city, not by total sessions, or the two records get added together as if they measured the same thing.
Table of Contents
- Which Google Analytics Reports Answer SEO Questions
- Metrics That Measure Visibility, Clicks and Engagement
- Search Visibility and Site Behavior Are Separate Stages
- Diagnosing Pages from Impressions, Clicks and Leads
- How to Build a Monthly SEO Report in GA4
- Measuring Leads by Service and Service Area
- Confirm Your Measurement Setup Before You Report Growth
Which Google Analytics Reports Answer SEO Questions
Google Analytics 4 doesn't ship a report called SEO. It ships five surfaces where organic search data appears, plus Search Console sitting outside it, and each one answers a different question. Knowing which row answers which question is most of the skill.
| Report | Where it lives | Key metrics | Question it answers |
|---|---|---|---|
| Google Organic Search Queries | Reports > Search Console (GA4) | Impressions, clicks, CTR, average position | Which search terms bring impressions and clicks? |
| Google Organic Search Traffic | Reports > Search Console (GA4) | Impressions, clicks, sessions, engagement | Which landing pages get organic visits, by country and device? |
| Traffic acquisition | Reports > Acquisition | Sessions, engaged sessions, key events | Which sources, including organic search, start sessions? |
| User acquisition | Reports > Acquisition | New users, key events | Which channel first brought each new user? |
| Landing pages | Reports > Engagement | Sessions, engagement rate, key events | Which entry pages lead to measured actions? |
| Search Console performance | search.google.com/search-console | Queries, pages, clicks, CTR, position | What happens before the click, over up to 16 months? |
The two rows to open first
Start with Google Organic Search Traffic, sorted by sessions and key events, then Traffic acquisition filtered to Organic Search. Together they show whether the landing pages earning visibility are also the pages producing sessions and measured actions. A ranking gain on a page nobody contacts you from is a vanity line.
The choice of report changes the conclusion you reach. Traffic acquisition is session-scoped and follows a non-direct last-click model, with a default key-event lookback window of 90 days, while User acquisition is user-scoped and describes how brand-new users first found the property. The same month of organic performance can look healthy in one and thin in the other, which is why Google documents the scope difference explicitly in its attribution guidance for GA4 reports.
Traffic acquisition separates organic search from paid, referral and direct only when your tagging is consistent. The separation runs on Session source, Session medium, Session source/medium and Session campaign, and untagged campaign URLs blur the lines between them, as the GA4 Traffic acquisition dimension reference sets out. Query-level data has its own hole: GA4 withholds rows when search-query data lacks enough users, and those thresholds are system-defined, so you can't adjust them.
A report that hides a withheld row and a report that hides a broken form look the same from the outside. Knowing which surface you opened tells you which one you're looking at.
Metrics That Measure Visibility, Clicks and Engagement
Six metrics carry every organic search conversation. Four come from Search Console and describe what happened in the search result. Two come from GA4 and describe what happened after the visit began. Blending them without labels is where most reporting goes wrong.
| Metric | Source | How it is calculated |
|---|---|---|
| Impressions | Search Console | Times a result appeared in Google |
| Clicks | Search Console | Visits from a search result |
| CTR | Search Console | Clicks divided by impressions |
| Average position | Search Console | Average across all appearances |
| Sessions | GA4 | Sessions starting on the landing page |
| Engagement rate | GA4 | Share of sessions that are engaged |
| Key events | GA4 | Marked user actions, such as form submissions or calls |
How the click-through ratio is calculated
CTR is clicks divided by impressions, nothing more exotic. A page with 10,000 impressions and 588 clicks shows 0.0588, which represents roughly 5.88% of impressions producing a click, the example Google uses in its documentation of the Google Organic Search reports in GA4. Run the division yourself before you interpret it, because a small denominator turns a handful of clicks into a dramatic percentage that means nothing.
Sessions and engagement rate come from GA4 and describe the visit rather than the listing. A session starts when someone lands on your page with your tracking in place. Engagement rate counts the share of those sessions that met GA4's engaged-session criteria, which is a floor for interaction, not a verdict on page quality.
Key events are the actions your business has decided matter. A consultation form submission, a click-to-call, a booking request, a quote download. Mark them deliberately, because GA4 can only count what someone configured.
Read the funnel in order
Each month, read visibility first (impressions), then the click (CTR and clicks), then the visit (sessions and engagement rate), then the action (key events). A break at any stop narrows the fix. Reading them out of sequence is how a traffic dip gets blamed on rankings when the problem is an unmarked form.
Reporting rule: When two metrics disagree, the disagreement is the finding. Don't average it away or pick the friendlier number. Find the stop where the chain broke.
That order also protects you from a common misread. Rising impressions with flat clicks isn't growth, it's exposure without persuasion, and it usually means the title is competing for a query the page never satisfies.
Search Visibility and Site Behavior Are Separate Stages
The click is the hinge. Everything before it happens inside Google's results, and everything after it happens on your site, and only if the tracking script runs. Two systems sit on either side of that hinge, and neither one sees the other's half.
That division is the whole map: visibility on the left, behavior on the right, with a single click connecting them.

Google's own documentation draws the line cleanly. Search Console supplies queries, impressions, clicks, CTR and average position. Analytics supplies sessions, engagement and conversions. A page can collect many impressions with few clicks, which points to a title, description, ranking or search-intent problem, or it can attract clicks that produce weak engagement and few leads, which points to a landing-page or conversion problem, as Google's Analytics reporting documentation explains. Same page, two different diagnoses, depending on which side of the hinge you look at.
Think of a shop. The window display pulls people off the street. The shop floor decides whether they buy. Search Console watches the street. GA4 watches the floor. Complaint letters about a quiet till rarely describe the window.
Why the two systems never match
Search Console records a search-result click. GA4 records a session only after the page loads and the tracking script executes, so JavaScript failures, ad blockers, tracking prevention, redirects and immediate exits create a persistent gap that never fully closes, as Search Console data limitations analysis notes. Google's integration hands you organic-search and query reports, but it does not merge query-level Search Console data with GA4 events such as form submissions or calls. Any "conversion rate by keyword" you publish is a modeled estimate built from a landing-page join, not an observed figure.
Run the three-stop check
- Visibility: impressions and average position tell you whether the page appears for the queries that matter. Falling impressions mean the page is losing the search result, not losing the argument.
- Click: CTR tells you whether the listing earns the click once it appears. Weak CTR with strong position is a copy problem in the title and meta description.
- Action: key events tell you whether the visit turned into an inquiry. Strong engagement with no key events is a tracking question first and a persuasive-copy question second.
Worked through once: a personal injury firm sees 640 Google clicks in Search Console and 512 organic sessions in GA4 for the same window. The instinct is to declare that SEO broke. The right move is to check tag firing on the thank-you page, confirm the phone tracking numbers swap correctly, and see whether the consent banner suppressed Analytics for part of the month.
Label every figure by its owner. Search Console owns impressions, clicks, CTR and position. GA4 owns sessions, engagement and key events. Keyword-level conversion rates belong in a third column labeled as an estimate.
A two-system report with a written boundary is more trustworthy than a clean single dashboard, even when the single dashboard is prettier. Before attributing a lead increase to SEO, confirm the instrumentation: tracked phone numbers, form events, thank-you-page behavior, consent effects, and any inquiry path that was never tracked at all.
Diagnosing Pages from Impressions, Clicks and Leads
The most common diagnostic error isn't misreading a page. It's judging a page before confirming the tracking works, because a missing key event and a page that persuades nobody produce the identical line in a report.
| Pattern | Likely cause | Check in GA4 or Search Console | Fix |
|---|---|---|---|
| Many impressions, low CTR | Title or snippet does not match query intent | Compare the query list with the page title | Rewrite the title and description around the query and service |
| Clicks, short engagement | Landing page does not answer the search | Check top queries for that landing page | Put the requested service and location in the first screen |
| Engagement, no key events | Conversion path missing or untracked | Check key events and phone or form tracking | Add or repair the key event before judging SEO |
| Traffic up, leads flat | Visits reach the wrong service or city pages | Segment landing pages by service and market | Strengthen pages with lead intent |
| Impressions flat, position slipping | Ranking loss or new competition | Compare position over matched date ranges | Review page content and links |
Which fixes show up fast and which take weeks
A repaired key event is the fastest win available. Google notes that standard reports can take up to 24 hours to display a newly marked key event, so a fixed form won't show its value the same afternoon you test it, as the GA4 key events documentation states. Title and description changes work on a slower clock: expect weeks before impressions and CTR settle into a new pattern, and don't rewrite the same title twice in one month.
Year-over-year work has a hard ceiling. Search Console retains 16 months of performance data and delivers it with roughly a 48-hour delay, so linked Analytics reports can't hand you an unlimited history, and older baselines have to be preserved through exports. Average position is an aggregate, not a fixed rank: URLs appearing at positions 3 and 7 record an average position of 5, per Google's Search Console and Analytics documentation. Change one variable at a time and recheck after the lag clears.
Proof of scale is not proof of leads. In an AVCO Roofing case study, Google search visitors per year rose from 1,935 to 4,593, a 137.36% increase in one year. That's a real number worth reporting, and on its own it still doesn't tell you whether those visitors called.
How to Build a Monthly SEO Report in GA4
A repeatable report beats a thorough one. Eight steps, run in the same order every month, will tell you more than an hour of clicking around a dashboard.
Here's the sequence at a glance, from connection to documented insight.
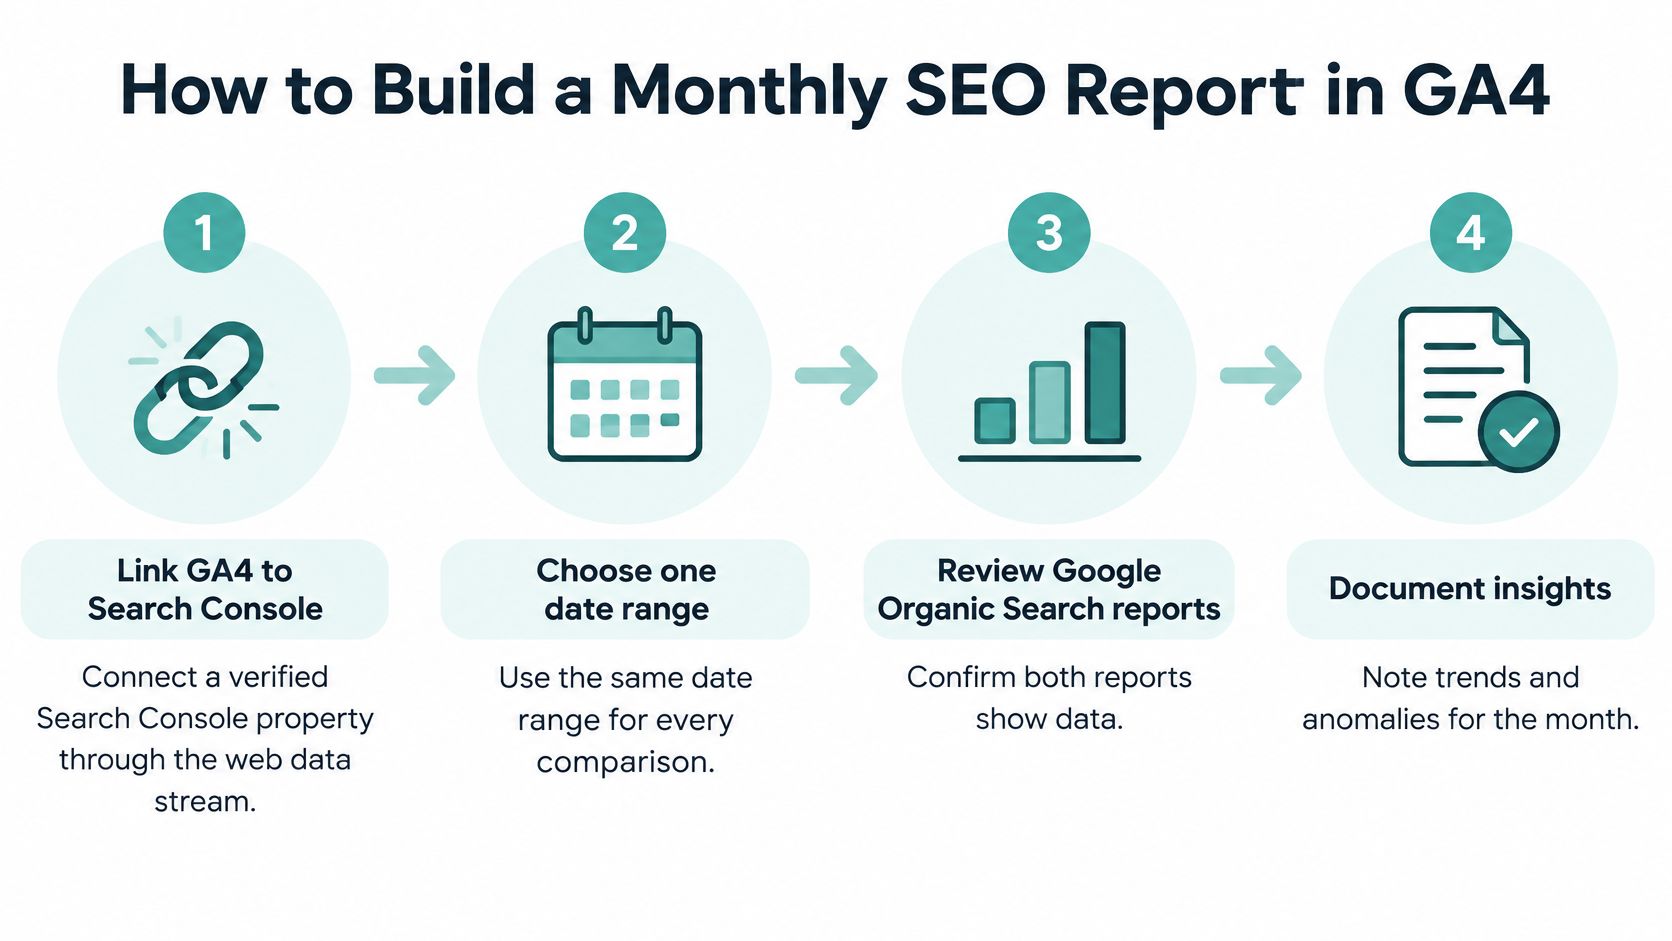
- Link the properties. Connect GA4 to a verified Search Console property through the web data stream, then confirm both Google Organic Search reports return rows. The integration produces two distinct reports, one for queries and one for landing pages, and the queries report can use Search Console dimensions only, not Analytics dimensions, as the GA4 Search Console integration guide sets out.
- Fix one date range. Pick the period once and use it for every comparison in the document. Treat the most recent days as incomplete rather than as a decline.
- Mark the lead actions. Form submissions, click-to-call and consultation bookings become key events before any analysis begins. Reports won't carry them until GA4 has processed them, so run a live test submission and wait before reading totals.
- Sort landing pages. Open Google Organic Search Traffic, sort by sessions and key events, then group the top pages by service. Twenty pages usually collapse into four or five services and a handful of cities.
- Hunt the weak queries. Open Google Organic Search Queries and list every term with high impressions and a low click rate. Those are your title-and-snippet candidates.
- Compare the channel. Check Traffic acquisition for organic sessions against the same period a year earlier, and confirm the organic line isn't absorbing referral or paid traffic through missing tags.
- Write three blocks. Visibility from Search Console, visits and engagement from GA4, then leads from key events. Keep each block labeled with its source so nobody adds the numbers together.
- Export and archive. Download the monthly data into a spreadsheet or warehouse, because a rolling window eventually drops the months you'll want next year. Our guide to SEO reporting dashboards shows how to assemble the exported views so they reconcile cleanly.
The recurring slips are predictable: daily slices so narrow that GA4 withholds rows, key events nobody marked, and a comparison month that doesn't match the current one. Data thresholds are system-defined and can't be adjusted, and low volumes increase the chance of withheld rows, so monthly and quarterly ranges give you steadier output than isolated daily pulls.
Monthly health check: both organic reports return data, one date range throughout, key events confirmed by a live test, landing pages grouped by service, weak queries listed, exports saved, and every figure labeled with its source.
Measuring Leads by Service and Service Area
Traffic by month doesn't help an owner decide where to spend next quarter. Service and city do. Segment the organic report by service, market and landing page, then ask which segment produced inquiries worth billing.
GA4 can describe on-site behavior but can't reveal the Google query behind a visit. Search Console can show queries, impressions, clicks, CTR and position, but it stops at the click. Query-level lead attribution therefore requires a modeled join between Search Console landing pages and GA4 conversion data, and it belongs in the report with its limits stated beside it rather than presented as precision, as Search Engine Land's GA4 guide frames the trade-off.
One segment, worked end to end
Take emergency roofing in Tyler. Pull the landing pages that serve that service and market, then line up impressions and clicks from Search Console against sessions and key events from GA4, and finish with the number of calls your team judged qualified. The shape below uses illustrative figures so you can copy the structure.
| Service and market | Impressions | Clicks | Sessions | Key events | Qualified calls | Note on limits |
|---|---|---|---|---|---|---|
| Emergency roofing, Tyler, TX | 12,400 | 310 | 244 | 9 | 6 | Query-to-lead is modeled from the landing-page join, not observed |
Three lines matter more than the totals in a table like that. A segment with heavy impressions and no inquiries takes the wrong-page route from the diagnosis patterns and needs its title and content matched to the service. A ranking gain that produces no inquiries goes to the conversion-path check before anyone celebrates. And a segment that shrinks while qualified calls rise is a win, because irrelevant visits leaving is the point.
That last one deserves saying plainly, since it runs against how most reports are read.
Lower traffic can represent better SEO when the irrelevant visits are the ones that disappeared. Judge the report on qualified inquiries and service-area coverage, not on the session count.
Missed opportunities belong in the same table rather than a footnote: high-impression queries with weak CTR, pages attracting traffic for a service you don't sell in that market, and terms where you rank well but nobody contacts you. If you're building the business case for that work, the method in our guide to measuring SEO ROI connects these segments to revenue.
One more link in the chain: the site has to support the segment you're reporting on. A service page built for a city you serve, with the service name in the heading and the phone number above the fold, gives the numbers something to measure. That's the same work we do as a web design and SEO partner for Longview, TX service businesses, and it applies whether the market is Longview, Tyler or Dallas.
Confirm Your Measurement Setup Before You Report Growth
Here's the decision, up front: confirm the measurement setup before you report any SEO growth. A growth claim built on a broken key event isn't optimistic, it's wrong, and it costs you credibility the first time someone checks.
Run these checks in order. Treat any failure as a stop sign for growth language.
- Both organic reports return data for the exact period you're reporting, not a neighboring one.
- Key events fire on a live test, submitted from a real browser on a phone, not from preview mode.
- Call tracking numbers swap correctly on the pages that take calls, and the calls land in a report you can read.
- Consent settings aren't swallowing a large share of Analytics data, which would shrink sessions without any change in demand.
- Exports run past the rolling window, since archived months are the only route to a year-over-year comparison once the history drops off.
- The comparison period matches in length, seasonality and campaign activity.
If every check passes, report by service and city using one date range and the same lag rule throughout. If any check fails, repair tracking first and publish only what's verified: impressions and clicks from Search Console, and sessions from GA4 with the limitation written next to them.
If you want help with the setup, our Discovery Meeting includes an in-depth analysis of your Google search traffic, a report of existing keyword rankings and which ones bring visitors, and a look at the clients you could reach with better rankings. It's a useful second set of eyes on whether the numbers you're about to publish will survive scrutiny.
Before that meeting, a plain-language refresher on what the platform records helps you ask sharper questions. And if the site itself is the bottleneck, our web design in Tyler, TX work starts with the same instrumentation pass, so the first month of reports is worth trusting.
Digital Skyrocket builds and reports on lead-generating websites for law firms, roofers, dentists, HVAC companies and other service businesses, with Google Analytics and Search Console wired together from launch rather than bolted on later. We meet with clients every month to review rankings, traffic and strategy against the same measurement boundary described here, so growth claims hold up when someone asks for the evidence. Visit Digital Skyrocket to see how the reporting and the site build fit together.