

A green Lighthouse score doesn't prove that your website feels fast to the people who generate revenue. A page can perform well in a controlled lab test and still feel sluggish on a mid-tier Android phone using a crowded mobile connection. That gap is why website speed optimization services should begin with real-user evidence, not a checklist of compression plugins and green badges.
For a lead-generation business, performance problems appear in practical ways. A visitor waits for the main service message to appear, taps a phone number that responds late, or starts a form before a chat widget shifts the page. The result isn't merely a technical defect. It can mean fewer calls, abandoned forms, and missed jobs.
Google's Core Web Vitals framework gives teams a useful way to measure those experiences, but the important measurement is the experience of actual visitors. Google evaluates these metrics at the 75th percentile, so optimization must account for the slower portion of traffic, not just the average or fastest users. The sections below explain what a serious provider audits, which fixes usually matter, how reporting should work, and how to choose a partner that can protect performance after launch.
Table of Contents
- Why Speed Optimization Is Not Just a Technical Checklist
- The Core Web Vitals Every Service Site Must Pass
- What a Speed Audit and Fix Package Actually Covers
- A Realistic Service-Business Speed Engagement
- Expected ROI and Conversion Lift From Faster Pages
- Deliverables, Reporting, and Engagement Models
- Choosing a Speed Optimization Partner Worth Hiring
Why Speed Optimization Is Not Just a Technical Checklist
A fast Lighthouse result can coexist with a slow customer experience. PageSpeed Insights provides a controlled diagnostic snapshot, while the Chrome User Experience Report, or CrUX, reflects real Chrome users across devices, networks, and locations. The first view helps identify possible causes. The second shows how visitors experience the page.
That distinction matters for service businesses. A visitor on an older phone or unstable mobile connection may wait for the main headline, tap a form field that responds late, or see content shift after appearing. Each delay creates a practical risk: fewer calls, abandoned quote requests, or missed appointments. A green lab score cannot show that loss by itself.
Practical rule: Use lab scores to investigate causes and field data to judge customer impact.
Why averages hide the expensive problem
Averages can make a page appear healthy while the slowest meaningful group struggles. Google's Core Web Vitals model evaluates real-user page views at the 75th percentile, so the target is a reliable experience for most visits, not an impressive result for fast devices. The Core Web Vitals assessment explains how that evaluation works.
For an agency reviewing a lead-generation site, the useful questions go beyond “What is the homepage score?” Which templates fail? Which devices and connections appear in those visits? Do the same scripts, fonts, or layout patterns affect service pages, location pages, and contact flows?
The slowest 25% deserve focused attention because they often include the visitors most exposed to weak mobile hardware or inconsistent connections. A provider that reports only one lab score cannot show whether a release helped those people or only improved a simulation. A sound engagement establishes a baseline, isolates the slowest visits, ships targeted fixes, and monitors real-user trends after deployment.
What a genuine performance program includes
Credible website speed optimization services combine diagnosis, implementation, and monitoring. The work may examine the rendering path, page weight, server response, fonts, JavaScript, and third-party tools. Each finding should connect to a business action, such as a phone call, quote request, appointment form, or consultation submission.
That connection prevents checklist-driven work. Removing an unused script may improve responsiveness on a mobile processor, while resizing a hero image may help visitors see the service promise sooner. A tracking tool may be acceptable on one template but delay a form on another. The priority should follow the user problem and its effect on conversion paths, not the number of warnings in a report.
The Core Web Vitals Every Service Site Must Pass
A service page can look fast in a lab and still feel slow to its least fortunate visitors. Core Web Vitals focus on three parts of that experience, and the practical question is whether the slowest 25% of real visits can see, use, and trust the page quickly enough to call or submit a form.
Largest Contentful Paint, or LCP, measures when the largest important element in the initial viewport becomes visible. On a service page, that may be the hero image, headline, or primary content block. It works like the storefront sign switching on. If the sign appears late, visitors wait longer to understand what the company offers. Google defines a good LCP as 2.5 seconds or less.
Interaction to Next Paint, or INP, measures how quickly the page visibly responds after a user interacts with it. It replaced First Input Delay as the responsiveness metric. The experience resembles pressing an elevator button and waiting for confirmation. A slow INP can make a phone-number tap, menu, or form field feel unresponsive. Google's good threshold is 200 milliseconds or less.
Cumulative Layout Shift, or CLS, measures unexpected movement during loading. A chat panel may push content aside, a font swap may change line breaks, or an image may load without reserved space. The result feels like trying to tap a button while the floor moves. A shifted submit button can interrupt a lead at the exact moment they are ready to contact the business. Google's good CLS threshold is 0.1 or less.
Google evaluates these results at the 75th percentile of real-user page views. In practical terms, a service site should examine the experience near the slower end of its visitor data, not rely on one convenient lab run. A page or origin passes only when the relevant results are good across the metrics, subject to Google's data requirements described in its PageSpeed Insights assessment guidance.
| Vital | Good Threshold | Poor Threshold | What Users Notice |
|---|---|---|---|
| LCP | ≤ 2.5 seconds | Above 4 seconds | The main headline or hero content appears late |
| INP | ≤ 200 milliseconds | Above 500 milliseconds | Taps, menus, forms, or phone actions respond slowly |
| CLS | ≤ 0.1 | Above 0.25 | Text, buttons, or forms jump while the page loads |
The middle ranges still deserve attention. Google Search Console classifies LCP from 2.5 to 4 seconds, INP from 200 to 500 milliseconds, and CLS from 0.1 to 0.25 as needs improvement, according to its Core Web Vitals report definitions.
The right fix depends on the conversion path. Poor LCP delays the promise that earns trust. Poor INP makes a call tap or form interaction feel broken. Poor CLS can move the form away from a visitor's finger. When these problems come from page structure or content hierarchy, the redesign playbook from 925 studios provides context for considering broader redesign work instead of isolated code changes.
What a Speed Audit and Fix Package Actually Covers
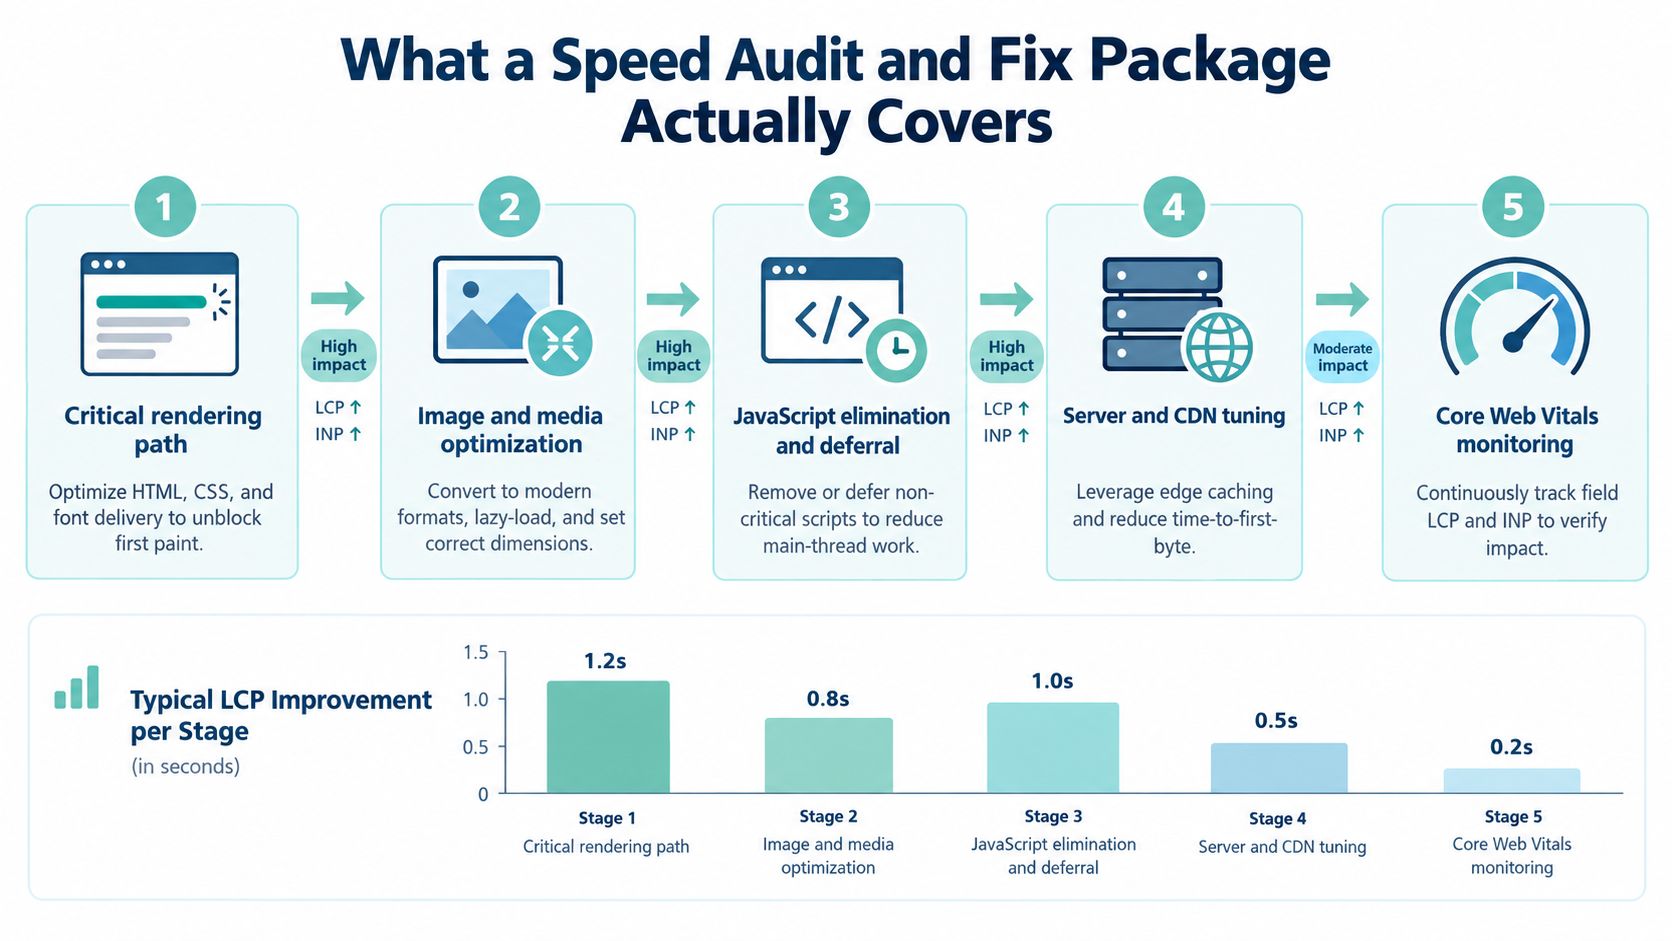
A serious audit starts with the path from the server response to the first useful screen. The provider should inspect how HTML, CSS, fonts, images, and scripts compete for the browser's attention. Chrome DevTools performance traces reveal main-thread work, WebPageTest filmstrips show what appears over time, CrUX lookups expose field behavior, and a Request Map identifies the requests that make the page heavy.
Start with the rendering path
The first priority is usually the content that determines LCP. Google recommends prioritizing the LCP resource with fetchpriority="high" or rel="preload" in its Web Vitals guidance. A provider may preload a carefully selected hero image, remove render-blocking CSS, improve font delivery, and defer scripts that aren't needed for the first view.
The goal isn't to preload everything. Overusing preload hints can make the browser fetch low-value assets earlier and compete with the main content. The team should identify the actual LCP element, confirm it in traces and field data, then give that resource an appropriate priority.
Reduce weight before tuning the server
Images, fonts, and JavaScript often create the largest practical opportunities on content-heavy service pages. The provider should inspect responsive image sizes, modern formats, lazy loading below the fold, font subsets, and unused CSS. Recent guidance notes that unused CSS can represent 50% to 70% of a site's stylesheets, according to Interact Marketing's discussion of Core Web Vitals.
Common fixes include generating responsive image variants, setting explicit image dimensions, reducing font requests, removing unused styles, splitting JavaScript bundles, and deferring non-critical code. For most lead-generation sites, these changes usually deserve attention before exotic server tuning.
Audit hosting and third-party behavior
Server response time still matters. A provider may review caching headers, origin performance, database work, CDN behavior, and time to first byte. The right configuration depends on the platform and traffic pattern, but the diagnostic question stays simple: how long does the browser wait before it can begin receiving useful page content?
Third-party scripts deserve their own review. Chat widgets, analytics, tag managers, review tools, and marketing pixels can consume main-thread time or inject layout changes. The team should use the Request Map and DevTools trace to identify which tools block rendering or delay interaction, then remove, replace, delay, or load them only where they serve a clear business purpose. Teams working on broader discoverability can also review guidance on how to optimize a site for ChatGPT, while keeping performance work tied to the actual page experience. A related technical SEO best-practices guide can help place those changes within a wider technical framework.
A Realistic Service-Business Speed Engagement
Consider a regional HVAC company whose CrUX report shows mobile LCP at 4.1 seconds and a form abandonment rate of 22%. The provider doesn't begin by installing a generic optimization plugin. It pulls field data from the last 28 days, reviews the pages receiving organic and referral traffic, and compares the customer-facing symptoms with controlled traces.
The lab trace exposes several render-blocking scripts. An asset review finds a 1.4MB hero image stack, while the interaction profile shows an unoptimized chat widget adding 680 milliseconds to INP. Those findings create a priority list, but the team still checks whether the same problems appear across service and location templates rather than fixing only the homepage.
Prioritization follows field impact
The first sprint focuses on server response time and image delivery. The provider serves an appropriately sized hero asset, improves its loading priority, and addresses the initial response path. Those changes target the delay that prevents visitors from seeing the company's primary HVAC message.
Third-party scripts move to a later sprint because the business needs to preserve essential measurement and customer support. The team delays the chat widget until it's needed, removes unnecessary work, and tests whether the form and phone actions remain reliable. That sequence avoids the common mistake of changing every script at once and losing the ability to identify the cause of an improvement or regression.
Results are judged in the field
After deployment, the company's mobile LCP falls to 2.1 seconds at the 75th percentile, INP moves from 310 milliseconds to 140 milliseconds, and booked-call form completions rise 18% week over week. Those figures describe this representative scenario, not a guarantee for every service site.
The important lesson is the order of operations. The provider connects the field baseline to specific user actions, ships fixes that address the largest delays, and verifies the outcome with the same real-user metrics. A fast-looking homepage wasn't the objective. A more reliable path from search visit to booked call was.
Expected ROI and Conversion Lift From Faster Pages
Speed work becomes easier to evaluate when the business defines the conversion event before the technical work starts. For a law firm, that may be a completed intake form or consultation call. For a roofer or HVAC company, it may be a quote request. The relevant question is not whether a score improved. It's whether more qualified visitors completed the next step.
One widely cited benchmark associates a one-second delay with about a 7% reduction in conversions, and the same benchmark discusses materially higher abandonment once load time exceeds 3 seconds, including mobile abandonment often cited at 53% in the site speed statistics benchmark. Those figures are directional benchmarks, not a promise that every LCP reduction will produce the same outcome.
A provider should therefore model ROI from the company's own baseline. Start with qualified sessions, current form or call completion behavior, lead quality, and the value assigned to a booked opportunity. Then compare the cost of implementation with the incremental opportunities that a sustained performance improvement could create.
| Improvement | Metric Moved | Conversion Lift | Bounce Reduction | Revenue Impact |
|---|---|---|---|---|
| Faster main content delivery | LCP | May improve completed lead actions | May reduce early abandonment | More visitors reach the offer and form |
| Faster interaction response | INP | May improve taps, menus, and form completion | May reduce frustration exits | More usable calls and submissions |
| Stable loading | CLS | May protect form and CTA interactions | May reduce accidental exits | Fewer lost opportunities during page load |
Avoid inserting unsupported revenue forecasts into a proposal. The verified benchmark provides a conversion relationship, but it doesn't establish a universal fee, lead value, or first-year return for a particular company. A useful SEO ROI measurement framework can help connect performance changes with organic traffic, qualified inquiries, and completed actions without confusing correlation with causation.
Faster pages may also support broader SEO and paid-landing-page performance, but a provider shouldn't guarantee ranking gains or assign a fixed advertising cost reduction without account data. The defensible business case is a controlled one. Record the baseline, change the experience, monitor field performance, and compare conversion behavior over a period that accounts for normal demand variation.
Deliverables, Reporting, and Engagement Models
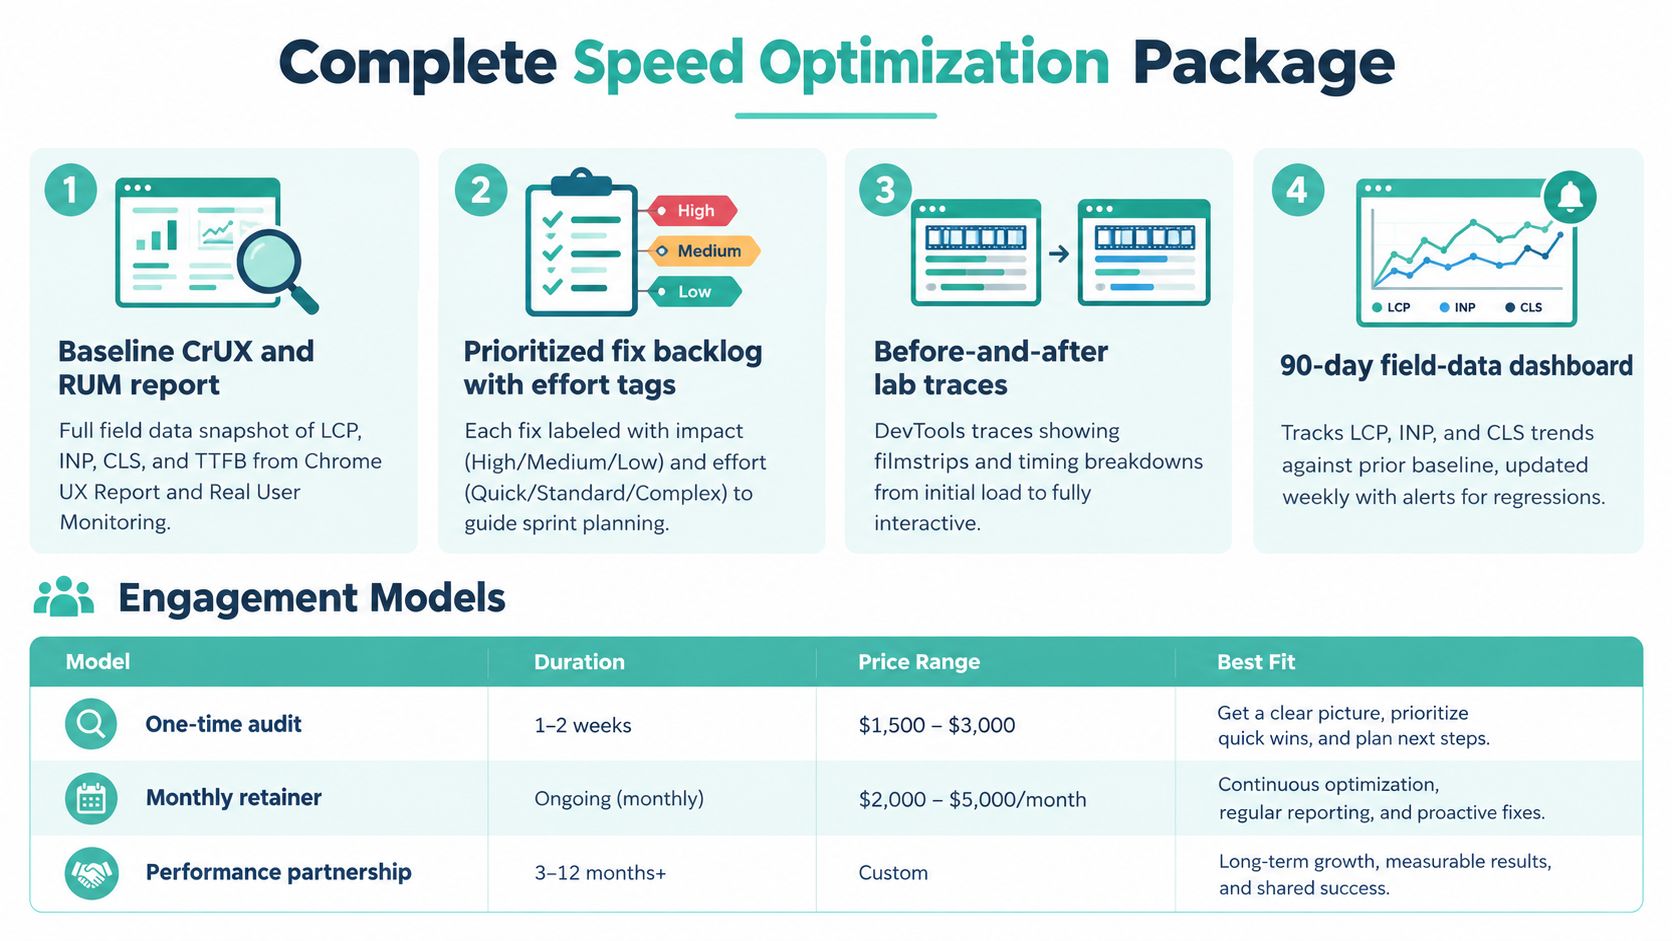
A complete package should leave the client with more than a PDF full of warnings. It should provide a baseline CrUX and real-user monitoring report, a prioritized backlog with effort tags, before-and-after lab traces, and a field-data dashboard that follows the slowest visitors over time.
What the reporting should show
The baseline should identify affected templates, devices, and page groups. The backlog should separate high-impact work from cosmetic improvements and explain the implementation risk. Before-and-after traces should show what changed in the loading sequence, not announce that a score is higher.
During active fixes, weekly status notes keep developers, marketers, and owners aligned. Monthly executive summaries should place LCP, INP, and CLS at the 75th percentile beside form completion rates and other agreed lead indicators. A SEO reporting dashboard resource can support broader reporting, but performance reporting still needs to preserve the distinction between lab tests and field data.
A 90-day field-data view is particularly useful after launch. It can reveal a regression caused by a new plugin, campaign tag, font, image library, or template update. The monitoring plan should specify who receives alerts, who investigates them, and how quickly the team can reverse or repair a change.
Choosing the engagement model
| Model | Best Fit | What It Provides | Main Limitation |
|---|---|---|---|
| One-time audit | A team with an in-house developer | Baseline, diagnosis, backlog, and implementation guidance | The client must execute and validate fixes |
| Monthly retainer | A site that changes frequently | Monitoring, regression alerts, fixes, and sprint reviews | Requires an ongoing working relationship |
| Performance partnership | A business tying performance to broader growth work | Continuous technical, SEO, and conversion coordination | Scope and commercial terms need careful definition |
Pricing should reflect the actual scope, platform, number of templates, and implementation responsibility. Be cautious with an SLA that promises a fixed pass-through rate for 12 months unless the provider controls deployments, third-party tools, hosting, and content changes. Google's thresholds can guide the target, but no provider can control every variable on a site they don't maintain.
Choosing a Speed Optimization Partner Worth Hiring
The right partner treats speed as an operating discipline tied to revenue, not as a one-time cleanup scored by Lighthouse. That distinction becomes clear after launch, when a new chat tool, analytics tag, page builder module, or redesign component can change the experience. A provider that only reports a lab score may miss the regression until customers feel it.
Look for evidence that the team has worked with real-user data. Documented CrUX improvements on past client sites are more useful than screenshots of perfect lab tests, provided the provider can explain the baseline, affected templates, device mix, and changes shipped. You also want engineers who can work in the render path and main thread, not only configure plugins or recommend generic settings.
Signals that separate specialists from checklist shops
A credible provider should offer a dashboard that refreshes at least weekly during an active monitoring program, with LCP and INP visible by template or page group where the data supports that view. It should explain how the team handles a third-party regression, who owns deployment decisions, and how performance changes connect to forms, calls, or other conversion events.
The warning signs are concrete:
- Plugin-first selling: The provider bundles speed plugins before examining the site's field failures.
- Lab-only reporting: Every result is a Lighthouse or PageSpeed score, with no CrUX or real-user context.
- No before-and-after evidence: The team won't share how field metrics changed after implementation.
- Ranking guarantees: The provider promises a specific ranking lift from speed work alone.
- No ownership model: Nobody can say who monitors regressions after a new script or template ships.
Digital Skyrocket is one option for service businesses that need performance work considered alongside custom WordPress development, technical SEO, local SEO, answer engine optimization, and conversion paths. Its stated focus is lead-generating websites for service companies, with ongoing reporting and iterative support rather than a standalone social or paid advertising service.
Questions to ask before signing
Ask each prospect these three questions and listen for the level of detail in the answer:
- How do you diagnose INP on a real device? A useful answer should describe traces, interaction timing, device conditions, and the scripts responsible for main-thread work.
- What happens if a third-party tag regresses LCP after launch? The provider should explain alerting, ownership, rollback, and testing rather than treating the issue as someone else's problem.
- Do you monitor the 75th percentile or only averages? The answer should include field data and the slower visitors who may be most likely to abandon a form or call flow.
The provider you hire should be able to show not only what it changed, but which real visitors benefited and how the team will know if that benefit disappears.
If your service website is losing potential calls or form submissions to slow, unstable pages, visit Digital Skyrocket to explore a website and SEO approach built around lead generation, technical performance, and measurable inquiry paths. Bring your current field data, page templates, and conversion concerns, and start with a focused conversation about what should be fixed first.